How to Read a Miner Profitability Ranking
A miner profitability ranking is a live multiplication: network output divided by network hashrate, priced in dollars and compared against the electricity the machine burns. At today's difficulty of 132.76 T, a 200 TH/s machine earns about $7.60 gross per day, and if it runs at 25 J/TH on $0.06/kWh power it spends $7.20 of that on electricity — a 40-cent daily margin before any pool fee. That single line tells you more than a page of specifications.

Key takeaways
- Revenue scales linearly with hashrate: at 1,003 EH/s of network hashrate, every terahash per second earns about 0.0000004486 BTC per day before fees.
- Costs scale with efficiency, not hashrate: a 200 TH/s machine at 17 J/TH draws 3.4 kW and clears $2.40 a day; the same machine at 25 J/TH clears $0.09 a day on $0.06/kWh power.
- The listed pool fee lands on the block-reward component at 4% under PPS+ and on the combined PPLNS distribution at 2%, so the ranking's gross figure is never the number that reaches your wallet.
- A ranking is a snapshot: the next difficulty adjustment is estimated at −2.12%, and a 2% move in difficulty reshapes every margin in the table.
The short answer
Read a profitability ranking in three steps. First confirm the revenue inputs — coin price, difficulty and block subsidy — because those decide the top line. Then subtract the machine's own power draw at your real electricity price, not the cheapest tariff advertised anywhere. Only then apply the pool fee, and only to the component it actually applies to.
Most rankings that disappoint their readers fail one of those three steps. They quote a factory power figure at a data-centre tariff, or they show gross revenue and leave the fee for you to discover later on a statement.
How the mechanism works
Bitcoin pays 3.125 BTC per block, and the network produces 144 blocks a day, so about 450 BTC of subsidy is distributed daily across the whole industry. Divide that by total network hashrate — currently near 1,003 EH/s — and you get the revenue rate every ranking is built on: roughly 0.0000004486 BTC per TH/s per day, which is $0.038 at a BTC price of $84,692.
Costs move on a different axis. Watts per terahash is the number that decides whether a machine survives a difficulty rise, and it has nothing to do with how large the machine is. A board that draws 20 J/TH costs the same per terahash whether it lives in a 200 TH/s chassis or a 20 PH/s rack.
The table below holds hashrate fixed at 200 TH/s and varies only efficiency, which is exactly the comparison a ranking makes across model families.
| Efficiency | Power draw | Electricity per day | Gross revenue per day | Margin after the listed 4% fee |
|---|---|---|---|---|
| 17 J/TH | 3.4 kW | $4.90 | $7.60 | $2.40 |
| 20 J/TH | 4.0 kW | $5.76 | $7.60 | $1.53 |
| 25 J/TH | 5.0 kW | $7.20 | $7.60 | $0.09 |
Three columns, three different machines, identical revenue. The left-hand column is the one that pays for the hardware, the electricity contract and the operator's time — or does not.
Where miners get it wrong
The most common misreading is comparing headline hashrate. A 25 J/TH machine with a big number on the box can rank below a slower, more efficient model on the same page, and the ranking is right to show it that way. Hashrate buys revenue; efficiency buys survival.
The second misreading is treating the displayed revenue as take-home. Gross revenue per day at 200 TH/s is $7.60; after the listed 4% fee on the block-reward component that becomes $7.29. The fee is small in absolute terms at this scale and much larger in percentage terms on a low-margin machine, because it applies before you pay power.
The third is ignoring time. A ranking read today is a claim about today. Difficulty moves every 2,016 blocks, subsidies halve on a schedule, and the estimated next adjustment is currently −2.12%, which would raise per-terahash revenue slightly if it holds. Anyone pricing a twelve-month return off a single ranking snapshot is pricing a variable as a constant.
Finally, few miners check whether the ranking's revenue estimate accounts for everything their pool actually pays. Merged-mining output, for example, is easy to omit: a machine mining Litecoin can also secure Dogecoin in the same work, and some profit calculator models include that auxiliary output while third-party sheets usually do not.[1]
A worked pass through the numbers
Take a 100-machine rack of 200 TH/s units, so 20 PH/s total, running at 20 J/TH. Twenty thousand terahashes at 20 joules each is 400 kW of continuous load: 9,600 kWh a day, which is $576 of electricity at $0.06/kWh.
Revenue at current difficulty is $759.87 a day gross, and applying the listed 4% rate to the block-reward component leaves $729.47. Subtract power and the rack keeps roughly $153 a day, about 20% of gross, before hosting, cooling, repairs and any labour. That is the number to compare against a lease payment, not the $759 headline.
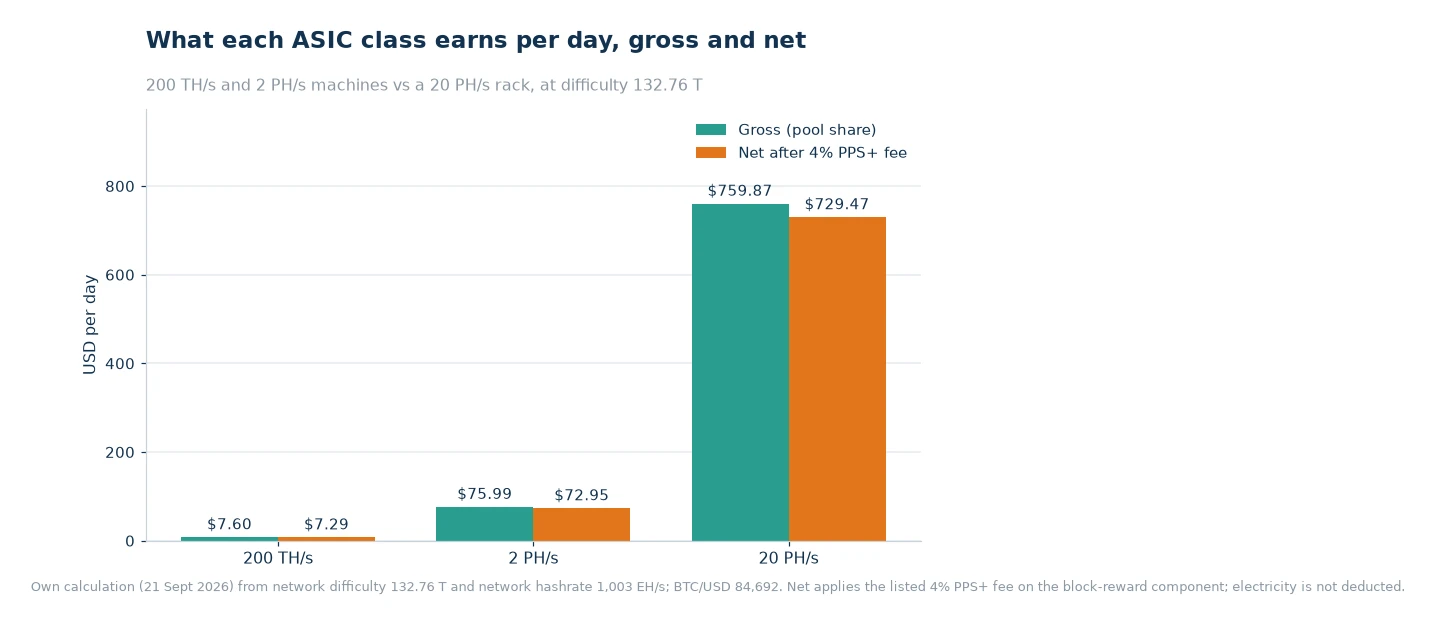
The same pass at machine level explains why the rack works at all. One 200 TH/s unit at 20 J/TH produces $7.60 gross, pays $5.76 for its own power and keeps $1.53 after the fee — nearly half of the rack's margin per unit-hour, carried by the efficiency class rather than the count. Swap those units for 25 J/TH hardware and the per-unit margin falls to 9 cents, which is why a live ViaBTC Miner Ranking is worth reading before a purchase order rather than afterwards.
A checklist you can run today
- Fix the revenue inputs. Write down difficulty (132.76 T today), BTC price ($84,692) and the per-terahash rate of 0.0000004486 BTC/day so the top line is not a guess.
- Use your own tariff. Run the watts figure against the price on your actual invoice, including demand charges if your supplier levies them.
- Apply the fee to the right component. Under PPS+ the listed rate is 4% on the PPS-settled block reward and 2% on the transaction-fee component; under PPLNS it is 2% on both together.[2]
- Stress the model. Re-run the arithmetic with difficulty 10% higher and BTC 10% lower. Machines that still clear power in that scenario are the ones worth buying.
- Check uptime assumptions. A rack at 95% uptime loses about 5% of revenue, which is often more than the entire fee.
- Confirm the payout rail. Zero-fee mining payouts inside a multi-currency account remove a withdrawal fee that monthly hardware maths usually forgets.
Frequently asked questions
Is a bigger pool always better?
Size reduces payout variance but also concentrates hashrate. What matters more is fee structure, uptime, latency and payout cadence.
What happens if my miner goes offline?
Shares stop, so expected income stops with them. Alerts and a dashboard that shows per-worker hashrate shorten the gap between a failure and a fix.
Does a ranking predict my profit next year?
No. It prices today's difficulty, subsidy and coin price. Difficulty adjusts roughly every two weeks and the subsidy halves on a fixed schedule, so a ranking is a starting point for a model you update, not a forecast.
Read it, then re-run it
Use a ranking to shortlist machines, never to justify a purchase on its own. Copy the inputs, rebuild the arithmetic in a spreadsheet with your own tariff and your own uptime history, and re-check it against fresh mining statistics every time difficulty retargets.
Three habits separate operators who stay profitable through a difficulty rise from those who do not: they track watts before hashrate, they deduct fees and power before comparing two machines, and they treat every published figure as a snapshot with a date attached.
Data and sources: ViaBTC miner ranking and fee schedule[1][2], and network difficulty from public chain data, all read on 21 September 2026. Revenue and margin figures are own calculations from difficulty 132.76 T, network hashrate 1,003 EH/s and BTC/USD 84,692, and move with those inputs.