Long-Tail Characters vs Chart Toppers
The choice between a chart-topping character and an obscure one is a trade between fit and findability, and the numbers make the trade visible. A card at the top of the weekly list carries reach in the millions and a favourite ratio near 0.0292%, while a long-tail card may never leave its own small label pool and yet match a specific reader far better. Neither is the right answer in general; the right answer depends on how much browsing time you are prepared to spend.

Key takeaways
- Chart toppers win on exposure: a single listing can show 7.1K favourites against 24.3M views, a ratio of about 0.0292%.
- Long-tail cards win on fit, because a narrow label pool is small enough for a specific card to sit at the top of its own search.
- The weekly chart is twenty entries rebuilt every Thursday, so the top of the catalogue is a rotating sample rather than a fixed best-of.
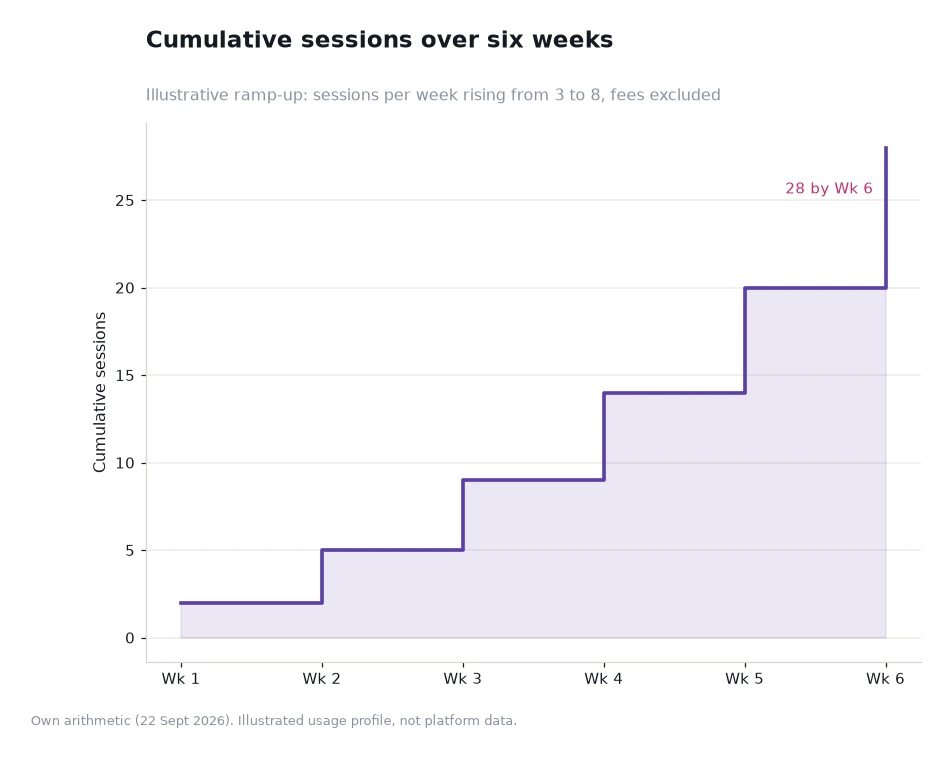
- Discovery cost is the real currency: an illustrated six-week ramp of 2, 5, 9, 14, 20 and 28 cumulative sessions is enough for both a chart browse and a narrow search.
What a chart position actually measures
A ranking measures reach and save behaviour together. A card near the top has been shown to a very large number of visitors and has converted a small fraction of them into favourites, which is why the ratio stays low even for a leader. Position tells you that many people found it acceptable, not that any particular reader will.
The mechanics behind position matter too. Twenty entries are refreshed every Thursday, and impressions follow position, so the same names tend to stay visible while they hold their slot. That compounding is good for the cards at the top and largely irrelevant to everything else in the catalogue.
What a long-tail card offers instead
A long-tail card competes in a much smaller pool. If a label set describes something specific, the search for it may return a few dozen entries, and a well-written card in that set can offer the best match available without ever appearing on a public chart. Fit is the entire proposition.
There is a practical cost, and it is time. Finding a strong long-tail card means knowing which label to run and being willing to open a handful of listings that turn out to be thin. The compensation is that the card you keep is usually a closer match than the eighth entry on a general chart.
The traffic question, quantified
Two readers with the same weekly budget get different results. One browses the chart: twenty cards, opening the first six, keeping one. That is one keeper from six opens. The other searches a narrow label that returns roughly thirty entries, opens eight, and keeps two, because the pool was already filtered for fit. Same number of opens, twice the keepers.
Neither reader has better taste; the second simply paid the filtering cost before opening anything. That is the whole trade in one sentence, and it is also why a shortlist from a narrow label tends to survive longer than a shortlist assembled from a chart.
| Measure | Chart topper | Long-tail card | What it means for you |
|---|---|---|---|
| Typical reach | Millions of views | Modest, often within one label pool | Reach is not fit |
| Favourite ratio | Around 0.0292% on a leading card | Can sit either side of that | Compare ratios, not totals |
| Competition for attention | Fierce; many similar entries | Light; fewer entries to compare | A narrow pool is easier to win |
| Discovery cost | Low; it is already at the top | Higher; you must know the label | Time is the price of fit |
| Ranking stability | Changes at each Thursday reset | Largely outside the public chart | Fit outlasts position |
Worked example: a six-week test of both approaches
The chart below tracks cumulative sessions across six illustrative weeks: two in week one, then three, four, five, six and eight. Summing gives 2 + 3 + 4 + 5 + 6 + 8 = 28 sessions, and the running totals read 2, 5, 9, 14, 20 and 28 at the end of each week.
Split those 28 sessions between the two approaches. Weeks one to three, 9 sessions in total, go to the chart: six opens per session, one keeper each, so three keepers from eighteen opens. Weeks four to six, the remaining 19 sessions, go to two narrow label searches: eight opens per session and two keepers, which is six keepers from twenty-four opens.
The comparison is deliberately generous to the chart, and it still produces three keepers against six. The session counts, the opens and the keep rates are all illustrated assumptions rather than platform data; the arithmetic is there to show which method deserves the larger share of a limited budget.
A mixed method that uses both
Use the chart for orientation and the labels for selection. The nsfw ai weekly ranking is the quickest way to learn which label combinations are populous, and the counters tell you whether a pool is converting. After that, the productive move is to leave the chart and search the label that matches your own taste, because that is where an unmatched card can be the best card available.
Two checks make the mixed method reliable. Before you commit to a narrow pool, confirm with the weekly rankings that the broad pools are not already carrying the register you want, and use the character search to see how many entries a label actually holds. On a catalogue of NSFW AI characters, most readers end up with a handful of long-tail keepers and one or two chart names they check occasionally, which is a reasonable place to land.
The two approaches also fail differently, which is worth knowing in advance. A chart-only reader ends up with a shelf of popular cards that all feel interchangeable, while a label-only reader can spend months inside one narrow pool and miss an entire register that a single weekly browse would have surfaced.
Frequently asked questions
Are long-tail cards lower quality?
No. They have less exposure, which is a fact about distribution rather than about writing. A card with a few thousand views can hold a far better setup than one with millions.
Is a low view count a warning sign?
Only if the ratio is low as well. A low total with a healthy ratio suggests a small, well-matched audience, which is exactly what a long-tail card is for.
How do I find a long-tail card deliberately?
Combine two conditions: an access filter plus one specific label. Run the label alone first to see the size of the pool, then add the second condition.
Do chart toppers change often?
The list of twenty is refreshed every Thursday, so the composition moves even when individual names persist.
Spend your time where the fit is
Start with the chart to learn the vocabulary, then move to the labels to find the card. Keep five names regardless of where they came from, and review the list once a week rather than once a day. Obscurity is not a fault and popularity is not a promise; the only measure that matters is whether the card you return to still matches what you wanted when you first chose it.
Data and sources: trend card counters and the weekly chart on the Crushon trends page[1], read 22 Sept 2026. Ratios are own arithmetic on those counters; the six-week ramp, open counts and keep rates are illustrated assumptions. Suitable for readers aged 18 or over.